SOLER Tools: PyOnset – A Python Package for SEP Event Onset Time Determination
As part of its technical objectives, the SOLER Project aims to provide new analytical and visualisation tools for solar energetic particle (SEP) studies that are publicly available to the scientific community. PyOnset has been created as part of the collection of time-series analysis tools, which, among others, also include multi-instrument and multi-spacecraft comparison plotters.

The Python tool, PyOnset, is designed so that users can either import the module into their own Python projects or access a Jupyter Notebook that has been set up to demonstrate the tool’s workflow. This can be done locally or without the need for any installation on the SOLER JupyterHub. The notebook starts by requesting the SEP event details and the selection of the spacecraft and instrument. With an automatically provided quicklook plot (see Fig. 1), the user can then inspect the event and determine the pre-event background.
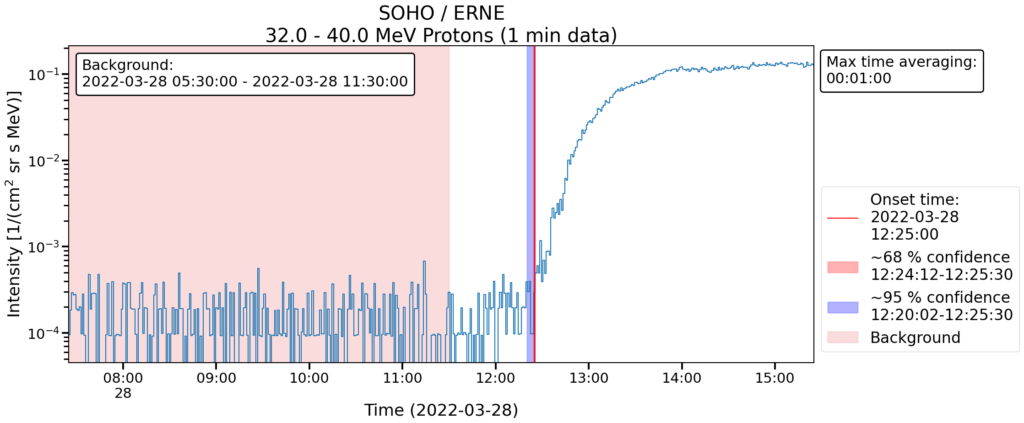
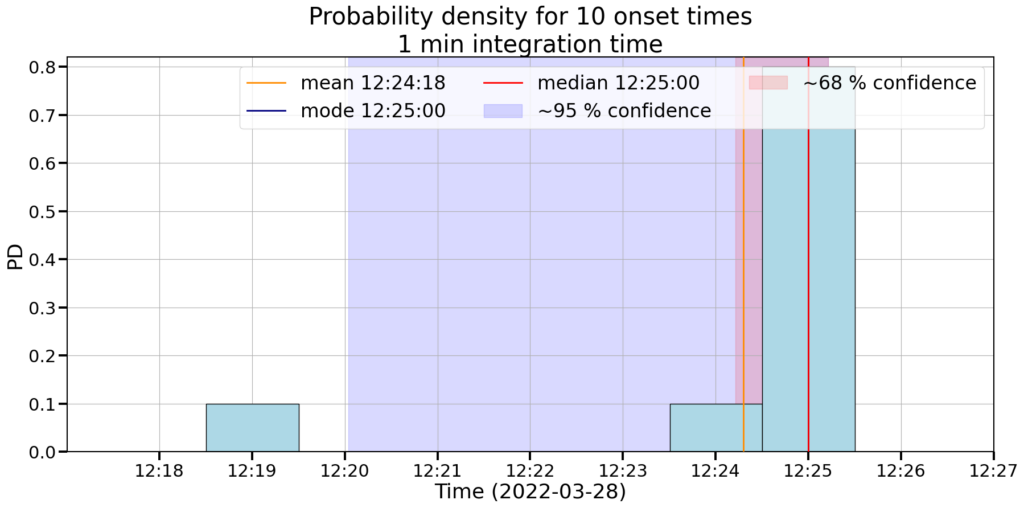
PyOnset will then determine the most probable onset time (see Fig. 2) using a novel hybrid method that employs a modified version of the Poisson-CUSUM scheme and statistical bootstrapping to find distributions of possible onset times, with additional methodological time-averaging to smooth out potential noise in the data. As auxiliary plots, one can produce, for example, a histogram of the onset time distribution (Fig. 3). These plots showcase the steps of how the software determines the most likely onset time for the event.
The tool was designed and created by Christian Palmroos and coworkers at the Space Research Lab (Department of Physics and Astronomy, University of Turku). To read more about this work, see the corresponding paper: Palmroos, et al. (2025) Astronomy & Astrophysics, 694, A221.
To access PyOnset: