SOLER Tools: Multi-Instrument and Multi-Spacecraft Energetic Particle Plotters
Modern solar energetic particle (SEP) studies rely on data from a growing number of spacecraft and instruments, each offering unique perspectives on solar activity. To help researchers make sense of this distributed observational landscape, the SOLER project introduces a set of comparison plotters designed for efficient visualisation across multiple spacecraft or a single spacecraft’s instruments. The Multi-Instrument Plotter and SEP Multi-Spacecraft Plotter are the next in the series introducing the SOLER tools.
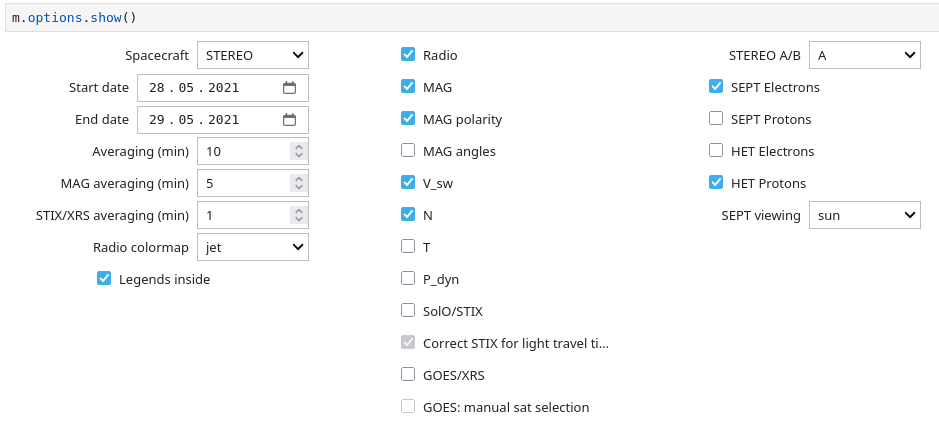
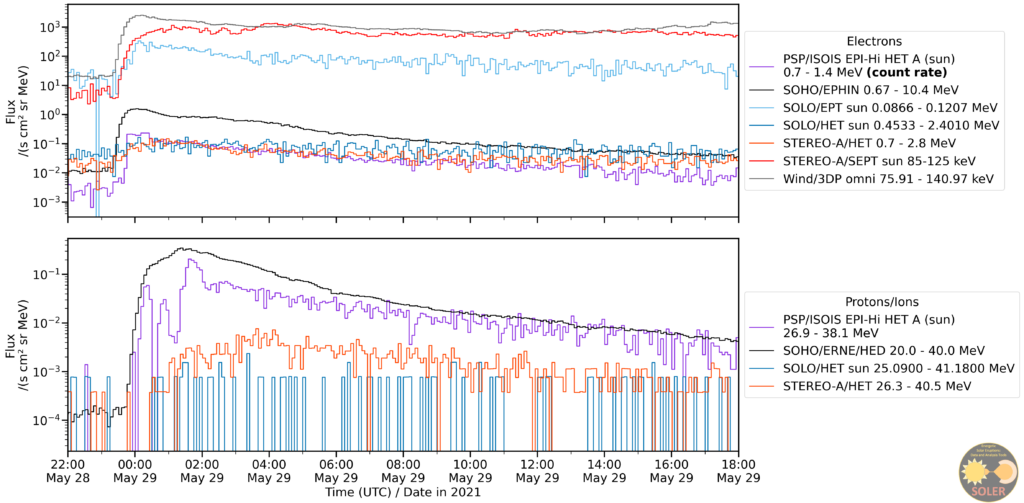
In the notebooks, both tools begin with a display of all the available options for datasets that can be selected with either drop-down menus or check buttons, as seen in Fig. 1. The relevant data is then downloaded and follow-up cells allow the user to further select certain energy ranges for the particle intensity data. The requested data is now ready to preview, as seen in Fig. 2 for the SEP Multi-Spacecraft Plotter.
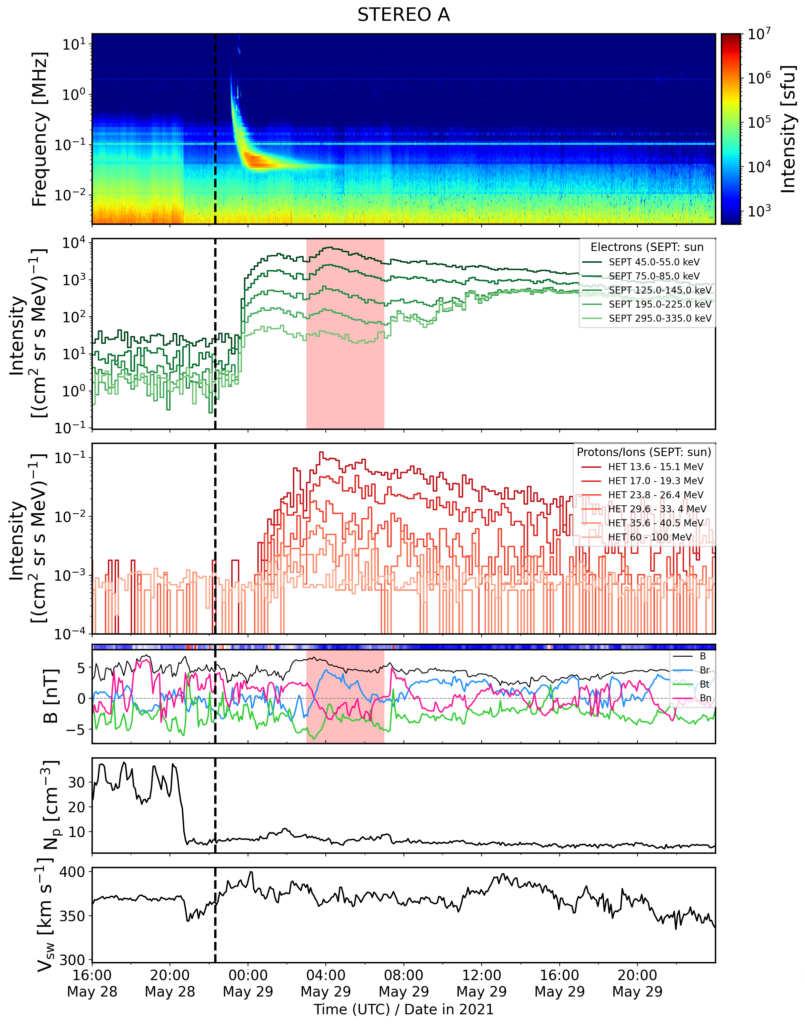
Finally, the user can make adjustments to the figures before saving, such as rearranging the panel order (multi-instrument plotter only), adding a line to indicate a flare start time in all the panels, or shading a region in a specific panel. Fig. 3 shows an example of these adjustments from the multi-instrument plotter with STEREO A for an event on 28 May 2021.
Both tools are available as step-by-step Jupyter Notebooks that can be run either locally or without installation via SOLER’s JupyterHub (requiring only a GitHub account for verification).
The Multi-Instrument and Multi-Spacecraft plotting tools were designed and created by Otso Santala, Jan Gieseler, and colleagues at the Space Research Lab (Department of Physics and Astronomy, University of Turku).
To access the plotters:
- GitHub: https://github.com/soler-he/sep_tools
- JupyterHub – Multi-Instrument Plotter: https://hub-route-serpentine-soler.2.rahtiapp.fi/hub/user-redirect/lab/workspaces/auto-8/tree/soler/sep_tools/SEP_Multi-Instrument-Plot.ipynb
- JupyterHub – Multi-Spacecraft Plotter: https://hub-route-serpentine-soler.2.rahtiapp.fi/hub/user-redirect/lab/workspaces/auto-8/tree/soler/sep_tools/SEP_Multi-Spacecraft-Plot.ipynb