SOLER Tools: Solar-MACH – Multi-spacecraft longitudinal configuration plotter
The SOLER project continues on from the hard work of the SERPENTINE project, making space physics studies more accessible to the public. SERPENTINE is where the Solar-MACH tool started as a web-app, but what is Solar-MACH? It is an open-source Python tool that displays the spatial configuration and solar magnetic connections of various orbiting bodies and spacecraft at a given time.
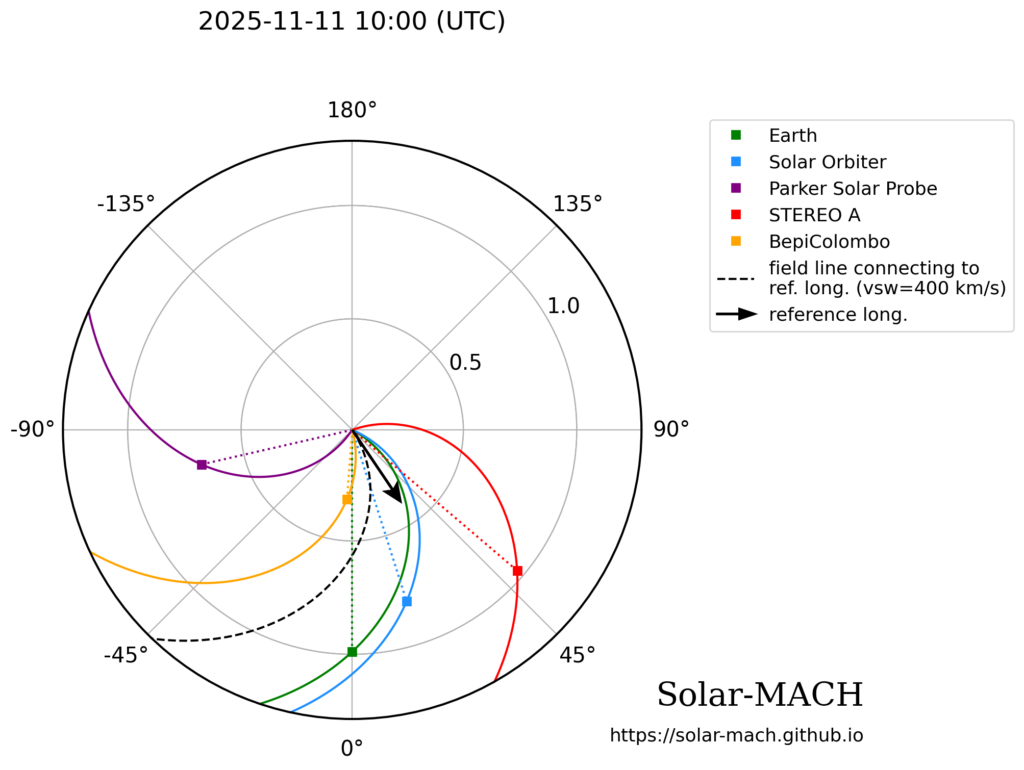
This tool, given the date and time (and a flare ‘reference’ coordinate, if it’s available) as well as the relevant observers the user is considering, plots the location of each observer at the given timestamp and ballistically backmaps the connecting magnetic Parker spiral to the Sun. A further output that is provided is a simple table providing all the data used to plot the diagram. Since the development of the Solar-MACH tool began with the 2D diagram used in Fig. 1, more features have been included. The Python tool (or web-app, however you choose to use it) can now also find the solar wind speed as recorded by the observing instruments and use it to backmap the Parker spiral more realistically.
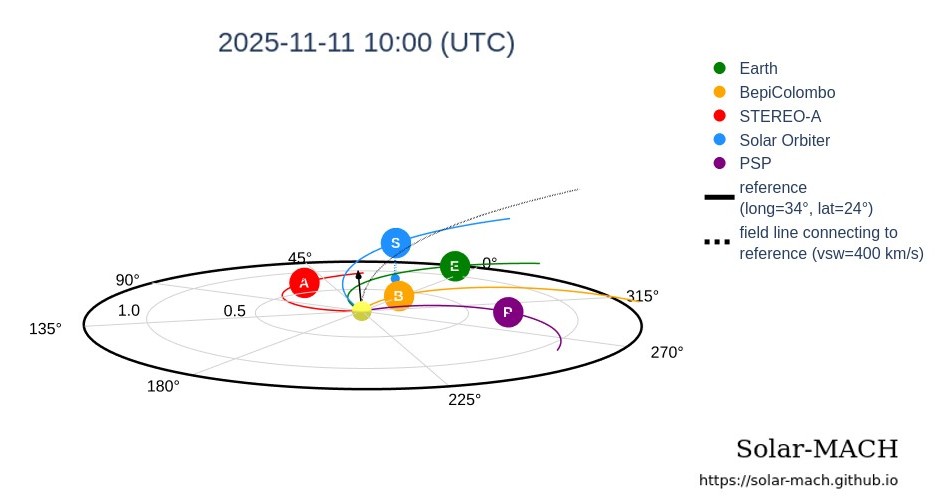
Beyond the backmapping, there is now the option to view the diagram in 3D. This comes just in time to visualise the latitudinal variation of Solar Orbiter’s path since it started its out-of-ecliptic phase at the beginning of 2025. Solar Orbiters’ latitudinal shift can be seen by converting Fig. 1 to 3D, shown in Fig. 2.
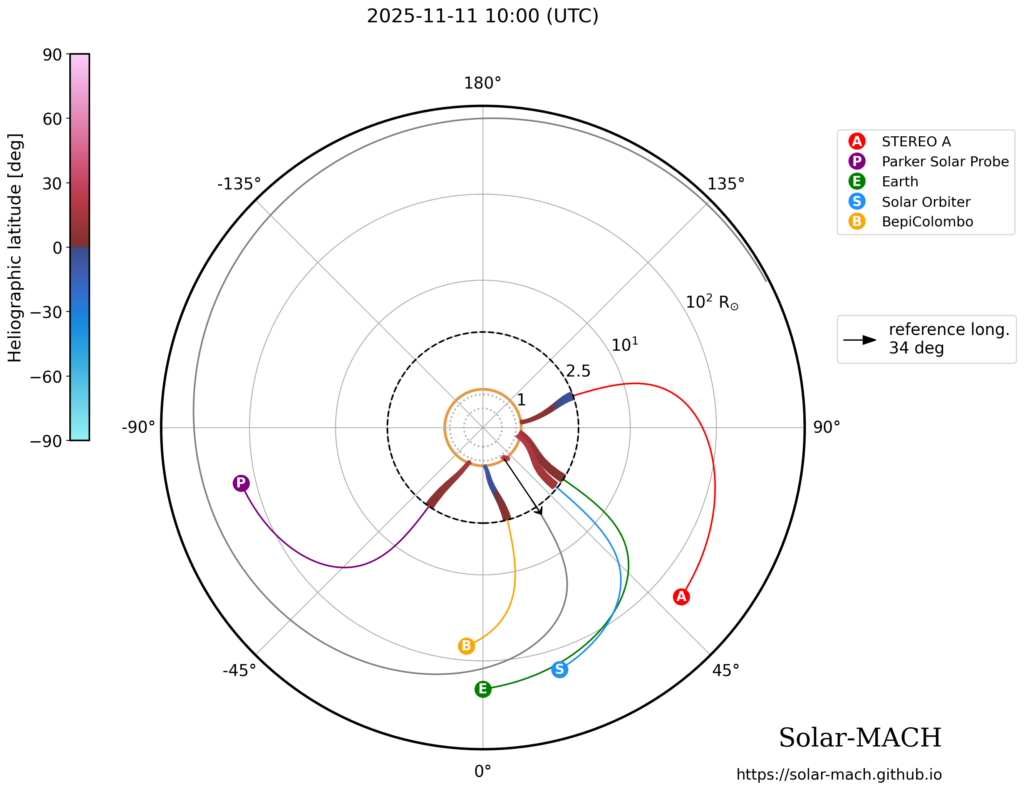
Another major update added to the Solar-MACH tool is the inclusion of a Potential Field Source Surface (PFSS) model, which further extends the magnetic connection of an observer to the solar corona. The result is shown in Fig. 3 for the same situation as in Figs. 1 and 2. It uses a semi-logarithmic radial scale, in which the newly determined coronal field lines are drawn in a linear scale in an inner circle up to 2.5 solar radii. Further out, the classic ballistically backmapped interplanetary magnetic field lines are drawn in a logarithmic scale in order to accommodate all details in a single figure. This model can also be examined in a fully zoomable 3D-view to better visualise the latitude of the field lines (indicated in Fig. 3 using the colorbar to the left).
The tool is designed and maintained by Jan Gieseler, Christian Palmroos, and colleagues at the Space Research Lab (Department of Physics and Astronomy, University of Turku). To read more about this work, see the corresponding paper: Gieseler, et al. (2023) Front. Astron. Space Sci, 9.
To access Solar-MACH, there is a web app, an online notebook with guided examples, or users can import the module to their own Python code.